Stats
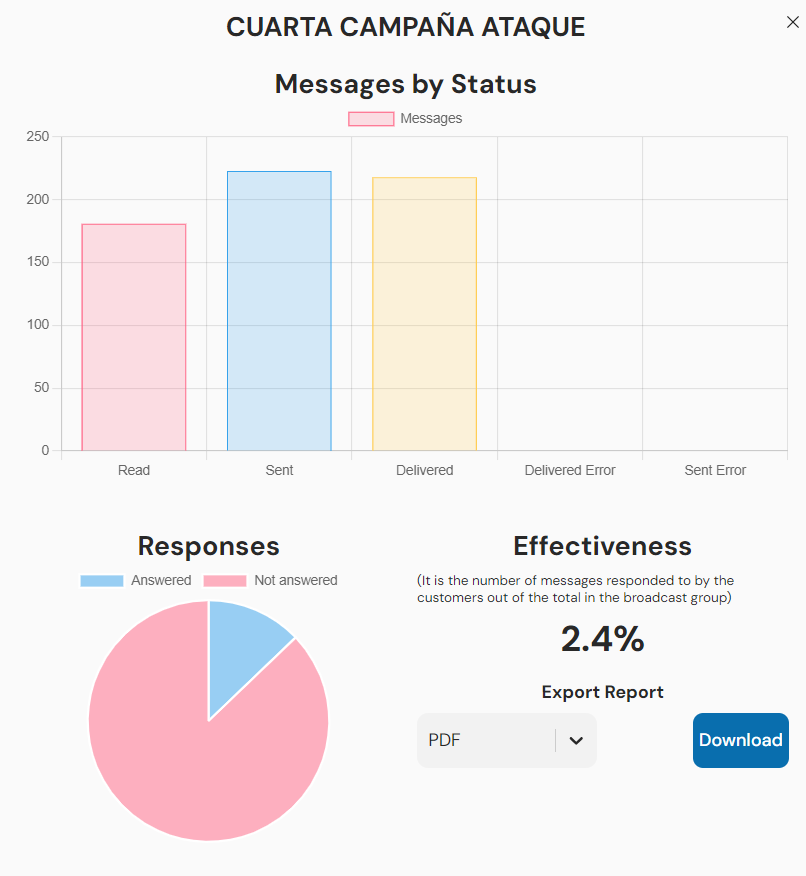
Once the campaign is created, selecting the symbol allows you to see the campaign's statistics graph. In the bar graph, you can see how many people read it, how many it was sent to, how many received it, how many were delivered with an error (successfully sent but not received by the client for any reason), and messages sent with an error (the message could not be sent to the client).
On the other hand, there is a pie chart graph that is evaluated by "responded" and "not responded." This value is based on the number of delivered messages. For example, if you have 50 delivered messages, the graph in its entirety represents 50 and is divided into responded and not responded.
Finally, there is an option to view the effectiveness of the campaign, with statistics on the number of messages responded to by clients over the total broadcast group. You can also download the results in a PDF or EXCEL file and see which numbers are invalid, to whom it was sent, and who responded.